
Very few locations over land have experienced hurricane force winds (SUSTAINED winds of 74 mph or more) so far, but several coastal locations have received gusts of 70-90 mph (see max gust map below)

This storm is a "classic" on how well our forecast models have done: superb track prediction and mediocre intensity forecasts. And the U.S. models did very well on track--better than the European Center model.
To illustrate, here are the forecast tracks from several models initialized on September 9th (last Sunday) at 11 AM PDT. Stunningly good prediction....aiming the hurricane landfall on the southern N. Carolina coast. All the models were doing the same thing...giving us some confidence in the track.
Absolutely marvelous.


But it would be nice to get intensity right as well. For the same 120 hr period shown in the track figure above, here is the intensity (central pressure of Florence) that was observed (black line) and forecast (colored lines). The observed storm strengthened rapidly during the early period, leveled off, and then weakened . The operational global model (GFS, shown by the blue AVNO line) was initially too weak and was too strong at the end. The new operational model (FV-3) was not deep enough for most of the storm. The high resolution US hurricane model (HWRF, purple line) was way too deep more of the time, including at landfall.
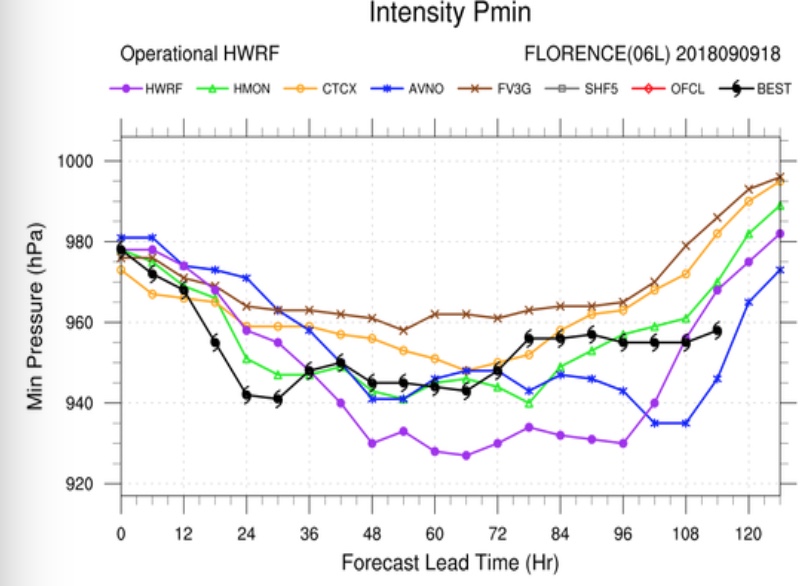
As I have noted before, getting track right demands getting the large scale flow correct--which we can pretty much do today. But getting intensity right demands we simulate the internal dynamics of the storm at high resolution...and do it correctly days ahead. Very difficult to do...and may be impossible according to some research (including research done at the University of Washington by my colleague Greg Hakim and students.)
One final piece of interesting hurricane information. Do you think the number of landfalling storms on the U.S. continental (mainly the SE US) is increasing, decreasing, or staying the same? I suspect many would say increasing, based on the considerable hype in the media.
The truth? A slow decline during the past few decades as shown by several papers in the peer-reviewed literature and government statistics. Here is a plot (a) from a 2018 paper by Klotzbach et al. in the Bulletin of the American Meteorological Society for hurricane landfalls on the continental US (1900-2017). Slight downward trend. Similar trend for major (categories 3 and above) hurricanes.

The big question is what will global warming do to the frequency of US landfalling hurricanes. Some research suggests that the most intense hurricanes will get more frequent, but the total number will decline. But what will happen to landfalling U.S. storms is something that is actively being studied.
from Cliff Mass Weather and Climate Blog https://ift.tt/2xjtgIy
No comments:
Post a Comment