Pages

Saturday, December 8, 2018

Lessons of the Failure of Initiative 1631, the Washington State Carbon Fee, Part 1: Election Analysis

This blog will examine the failure of Initiative 1631, the carbon fee initiative, which would have placed an escalating tax on carbon-based fuels and then given the authority to distribute the funds to an appointed 15-person board.   It was the most expensive initiative battle in Washington State history, with reported expenses of nearly 50 million dollars, and it failure received both national and international attention.
  

Why did 1631 fail?   Did "big oil" secure its downfall?    Was 1631 essentially flawed?   These are all important questions, because we need to know how to proceed in the future.   Global warming is a serious challenge for mankind and we can't afford to waste such extraordinary resources, with nothing to show for it.  Only knowing why it failed can we find a better way forward.  This is the first in a series of blogs to analyze the situation.

Election Data

    1631 was decisively defeated:  56.6% were against, 43.% for:  a large 13% loss.   Only three counties produced a majority for the initiative:  King (mainly Seattle) voters, Jefferson (mainly Port Townsend folks) and San Juan County (see below).


The core support for I-1631 was from liberal-leaning urban and tribal areas, with most rural and suburban locations voting against.   This division is illustrated in Kitsap county, with wealthy/heavily Democratic Bainbridge Island and the Suquamish tribal areas voting for and most of the rest of the county opposing.

It is instructive to compare the I-1631 vote with than of I-732, the revenue-neutral carbon tax initiative of 2016.    Results were only slightly better (a shift of less than 3 points), with only San Juan and King County supporting the carbon tax.


There was a nice 1631 analysis published in Crosscut Magazine by some of my colleagues at the UW (Steven M. Karceski, Nives DolÅ¡ak and Aseem Prakash).  First, comparing county votes of 1631 and 732, they found a distinct pattern, with greater support for 1631 (over 732) in the most liberal/Democratic counties (King County showed roughly a 5% improvement), while ground was lost in some of the more Republican counties of the eastern side of the State).   As some post-election polling done by the Yes side confirmed, I-1631 heightened the partisan divide across our state:  few Republicans voted for it and most supporters were Democrats.


But interestingly, many liberal/Democratic voters voted against it.   As shown in the Crosscut article many voters who supported Maria Cantwell (the champion of coastal weather radar!), did not vote for the initiative (see graph below).  That is true in EVERY county of the state  That fact will going to turn out to be very important.

I attended a meeting on November 28 sponsored by the Low Carbon Prosperity Institute, which included some post-election poll results sponsored by the Yes on 1631 campaign.  The pollster,  Dave Metz of FM3 Research, found that both No and Yes sides were effective in getting their messaging out, and noted the extreme partisanship of the electorate on this ballot measure.  He found that about 25% were dead set against it (mainly core Republicans in eastern WA), about 30% were worried about climate change but thought 1631 was bad policy), and the rest were worried about climate and either supported the initiative or were willing to give it a chance.

So, which Democrats did not vote for 1631?   And how did lower-income and minority folks feel about the initiative?   Well, I decided to try my hand at election analysis using official Washington State demographic data.

First, what about income and voting preferences on 1631?  Here is a plot of percent Yes vote versus medium county income for all WA State counties.  A least-squares linear fit trend line is shown as well.   In general, counties with lower income tended to vote no on 1631.  The best fit line showing this relationship explained about 30% of the variation.


What about minorities (non-white, state of WA definition)?  A lot of scatter, but a tendency for a No vote when minority percentages increase.


How about hispanic groups?  (see below).   A stronger relationship.  The three counties that voted for the initiative have low-hispanic populations and heavily hispanic districts were strongly against the initiative.


    All of these, and other, results, suggest that lower income and minority citizens of our state, many of them Democratic leaning, were uncomfortable with the initiative.  This is consistent with direct feedback I received when talking to primarily working-class groups (such my talk to facilities management folks on snow/ice conditions) and the fact that many labor unions in our state (e.g., the steelworkers and construction unions) were against it.

    I believe that the bottom line is that 1631 lost because most Republicans were against it, low income, construction/labor, and minority groups were wary of its economic impacts on their lives, and a significant proportion of climate-concerned folks, many of them log-term Democrats, were uncomfortable with aspects of the policy.  

    In fact, there was clear signs that 1631 was in trouble early in the election period--well before the No campaign started to aggressively push its message.  The Crosscut/Elway poll, based on sampling in early October, showed only 50% supported the initiative, based on a telephone poll.  Elway himself said that only measures that started in the high-50s% had much of a chance.

    But it was worse than that.  The questions told folks that "large emitters" would pay the bill and that all kinds of wonderful things would happen (see below).  Even with such a give-way, only 50% would support it.   A profound warning sign--many people did not buy it.


    In the next blog on this subject I will examine the politics of 1631, suggesting that a poorly constructed initiative, a flawed strategic plan by the 1631 folks,  an unwillingness of the population to sacrifice to deal with global warming, and a steady, disciplined effort by the No folks, resulted in the decisive defeat of 1631.

    from Cliff Mass Weather and Climate Blog https://ift.tt/2ElLrmW

    Thursday, December 6, 2018

    Less Sad in Seattle

    Have you noticed that people are a bit happier in Seattle this fall?   More smiles and less complaining?   

    One explanation might be the unusual amount of sun this fall, which lifts the spirits and relieves the sufferers of Seasonal Affective Disorder (SAD).


    November and December should be dark, gloomy times here in the Pacific Northwest.   The sun is naturally weaker and shorter-appearing due to the time of the year.   And its feeble rays are usually further weakened by considerable cloud cover, as Pacific weather systems reach our region.

    In two days we will have the earliest sunset of the year (4:17 PM) and we are within the lowest daylight time of the year (see the sun plot below).


    Just thinking about this is usually depressing.   But not this year!  Because this year we have had unusual amounts of sun.

    Consider the solar radiation received here in Seattle (below).  We had a rough patch of low sunshine from Nov. 21 to Dec 2, but other than that we have had some relatively bright, sunny periods, including today and the last few days.


    Much less sun last year.


    Or in 2015 (which had a relatively bright period in early November)


    To get so much sun in early December is a gift from the weather gods, that provides a huge psychological boost to those of us trying to get through the winter.   A month from now, the days will be getting noticeably longer and storms will fade a bit.  NOW is when we need the sun and we are getting it.

    You may ask:  why the solar bounty this year? 

    The reason is that for the past month there has been a persistent upper-level ridge of high pressure just to our north and east, providing descending, cloud-busting air.    This is illustrated below, with a map that shows the anomaly from climatology (difference from average) of the heights of the 500 hPa pressure surface over the past 30 days.   Red indicates much higher than normal heights (or equivalently pressure).  Lots of red just to our northwest...exactly where we need it.


    Like sea-level pressure better?  Here is the difference from normal for almost the exact same period.  Higher than normal pressure (yellows and orange colors) offshore

    Ironically, a lot of our storms have been heading south into California, which has been hammered by rain, wind, and clouds.

    So turn off your light boxes and get outside today....it will make a huge difference in your mood for weeks to come.

    from Cliff Mass Weather and Climate Blog https://ift.tt/2PkyTxm

    Less Sad in Seattle

    Have you noticed that people are a bit happier in Seattle this fall?   More smiles and less complaining?   

    One explanation might be the unusual amount of sun this fall, which lifts the spirits and relieves the sufferers of Seasonal Affective Disorder (SAD).


    November and December should be dark, gloomy times here in the Pacific Northwest.   The sun is naturally weaker and shorter-appearing due to the time of the year.   And its feeble rays are usually further weakened by considerable cloud cover, as Pacific weather systems reach our region.

    In two days we will have the earliest sunset of the year (4:17 PM) and we are within the lowest daylight time of the year (see the sun plot below).


    Just thinking about this is usually depressing.   But not this year!  Because this year we have had unusual amounts of sun.

    Consider the solar radiation received here in Seattle (below).  We had a rough patch of low sunshine from Nov. 21 to Dec 2, but other than that we have had some relatively bright, sunny periods, including today and the last few days.


    Much less sun last year.


    Or in 2015 (which had a relatively bright period in early November)


    To get so much sun in early December is a gift from the weather gods, that provides a huge psychological boost to those of us trying to get through the winter.   A month from now, the days will be getting noticeably longer and storms will fade a bit.  NOW is when we need the sun and we are getting it.

    You may ask:  why the solar bounty this year? 

    The reason is that for the past month there has been a persistent upper-level ridge of high pressure just to our north and east, providing descending, cloud-busting air.    This is illustrated below, with a map that shows the anomaly from climatology (difference from average) of the heights of the 500 hPa pressure surface over the past 30 days.   Red indicates much higher than normal heights (or equivalently pressure).  Lots of red just to our northwest...exactly where we need it.


    Like sea-level pressure better?  Here is the difference from normal for almost the exact same period.  Higher than normal pressure (yellows and orange colors) offshore

    Ironically, a lot of our storms have been heading south into California, which has been hammered by rain, wind, and clouds.

    So turn off your light boxes and get outside today....it will make a huge difference in your mood for weeks to come.

    from Cliff Mass Weather and Climate Blog https://ift.tt/2PkyTxm

    Tuesday, December 4, 2018

    It is Darkest Before the Dawn, But When are Surface Air Temperatures the Lowest

    Here is an interesting question.   During a clear night and day like we have just had, when is the coldest temperature observed?

    1.  10 PM
    2.  4 AM
    3.  6 AM
    4.  Right before Sunrise
    5.  Just After Sunrise
    6.  9 AM
    Did you write it down?

    The answer is generally just after sunrise, although temperatures are pretty similar in the prior hour or so.

    Today's sunrise was at 7:40 AM.  Let's check out the temperatures at some local stations.   A good place to go for higher time resolution is the WSU AgWeather Site (every 15 minutes).  Starting with Seattle, the surface air temperature (red line) is lowest around 6:30 AM, but doesn't really rise until after 8:30 AM


    Coupeville on Whidbey Island is coolest just after sunrise


     Woodinville... just before sunrise


    Or the Weatherunderground site near SeaTac Airport (KWASEATT1683), with the lowest temperature right after sunrise


    You will also notice that the highest temperatures this time of the year are quite early....around 2 PM, in comparison to 5-6 PM during summer.  And most of the daily cooling occurs between roughly 3:30 and 8 PM.

    So why are the lowest temperatures often at or just after sunrise?   With no solar radiation at night, the earth cools by emitting infrared radiation to space.  That in turn cools the adjacent air layers. But how can the temperatures continue to cool or stay the same for a while when the sun comes up?

    Good question.  Because it takes a while for the incoming solar radiation to be larger than the outgoing infrared radiation.  Eventually, the solar radiation wins, but that can take 15-30 minutes to happen.

    Tomorrow, Wednesday, morning should be similar to today...so watch your thermometer.


    from Cliff Mass Weather and Climate Blog https://ift.tt/2E5Rprt

    It is Darkest Before the Dawn, But When are Surface Air Temperatures the Lowest

    Here is an interesting question.   During a clear night and day like we have just had, when is the coldest temperature observed?

    1.  10 PM
    2.  4 AM
    3.  6 AM
    4.  Right before Sunrise
    5.  Just After Sunrise
    6.  9 AM
    Did you write it down?

    The answer is generally just after sunrise, although temperatures are pretty similar in the prior hour or so.

    Today's sunrise was at 7:40 AM.  Let's check out the temperatures at some local stations.   A good place to go for higher time resolution is the WSU AgWeather Site (every 15 minutes).  Starting with Seattle, the surface air temperature (red line) is lowest around 6:30 AM, but doesn't really rise until after 8:30 AM


    Coupeville on Whidbey Island is coolest just after sunrise


     Woodinville... just before sunrise


    Or the Weatherunderground site near SeaTac Airport (KWASEATT1683), with the lowest temperature right after sunrise


    You will also notice that the highest temperatures this time of the year are quite early....around 2 PM, in comparison to 5-6 PM during summer.  And most of the daily cooling occurs between roughly 3:30 and 8 PM.

    So why are the lowest temperatures often at or just after sunrise?   With no solar radiation at night, the earth cools by emitting infrared radiation to space.  That in turn cools the adjacent air layers. But how can the temperatures continue to cool or stay the same for a while when the sun comes up?

    Good question.  Because it takes a while for the incoming solar radiation to be larger than the outgoing infrared radiation.  Eventually, the solar radiation wins, but that can take 15-30 minutes to happen.

    Tomorrow, Wednesday, morning should be similar to today...so watch your thermometer.


    from Cliff Mass Weather and Climate Blog https://ift.tt/2E5Rprt

    Sunday, December 2, 2018

    Our New Weather Satellite is In Position

    GOES-17, the new National Weather Service weather satellite, is now in position over the eastern Pacific.    And you should expect to see substantially improved weather imagery in the future....on this blog and everywhere else.

    GOES-17

    GOES-17 is a geostationary weather satellite, positioned over the equator at 137°W, that views the earth from 22,000 miles above the surface.  It is scheduled to go operational next week (December 10th) and will then be known as GOES-W.   For acronym lovers, GOES stands for Geostationary Operational Environmental Satellite.  In geostationary orbit, a satellite stays above the same location of Earth.

    There some great websites for viewing GOES-17 imagery, with one of my favorites being this one, which shows visible imagery during the day and infrared at night.  Let me show you an image from 11:15 AM Saturday.  Magnificent.  And notice something?  It is in color!  The previous geostationary satellite was in black and white.


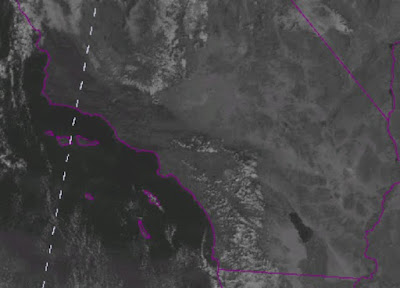
    To get an idea of how much better the new GOES-17 satellite is than the current GOES-15, below is a comparison of the visible imagery at 9:45 AM Saturday morning.

    On the top is the current visible imagery; on the bottom is GOES-17.  Pretty dramatic difference!


    GOES-17 has roughly twice the horizontal resolution compared to the current satellite, scans the planet much more frequently, and views the earth in more wavelengths.  In fact, GOES-17 views the earth in 16 wavelength bands simultaneously, each one providing different information about clouds, the atmosphere, and the surface (see below).


    And GOES-17 has a major new capability:  it is able to view lightning from space, sensing the lightning emitted from each pulse  (watch the video below!).


    In short, GOES-17 will be a major advance for weather prediction and is an example of the expensive infrastructure that acts as a foundation for modern weather forecasting.

    from Cliff Mass Weather and Climate Blog https://ift.tt/2PamzQd

    Our New Weather Satellite is In Position

    GOES-17, the new National Weather Service weather satellite, is now in position over the eastern Pacific.    And you should expect to see substantially improved weather imagery in the future....on this blog and everywhere else.

    GOES-17

    GOES-17 is a geostationary weather satellite, positioned over the equator at 137°W, that views the earth from 22,000 miles above the surface.  It is scheduled to go operational next week (December 10th) and will then be known as GOES-W.   For acronym lovers, GOES stands for Geostationary Operational Environmental Satellite.  In geostationary orbit, a satellite stays above the same location of Earth.

    There some great websites for viewing GOES-17 imagery, with one of my favorites being this one, which shows visible imagery during the day and infrared at night.  Let me show you an image from 11:15 AM Saturday.  Magnificent.  And notice something?  It is in color!  The previous geostationary satellite was in black and white.


    To get an idea of how much better the new GOES-17 satellite is than the current GOES-15, below is a comparison of the visible imagery at 9:45 AM Saturday morning.

    On the top is the current visible imagery; on the bottom is GOES-17.  Pretty dramatic difference!


    GOES-17 has roughly twice the horizontal resolution compared to the current satellite, scans the planet much more frequently, and views the earth in more wavelengths.  In fact, GOES-17 views the earth in 16 wavelength bands simultaneously, each one providing different information about clouds, the atmosphere, and the surface (see below).


    And GOES-17 has a major new capability:  it is able to view lightning from space, sensing the lightning emitted from each pulse  (watch the video below!).


    In short, GOES-17 will be a major advance for weather prediction and is an example of the expensive infrastructure that acts as a foundation for modern weather forecasting.

    from Cliff Mass Weather and Climate Blog https://ift.tt/2PamzQd