Over eastern Washington a number of rivers are at flood stage, some reaching record levels.
Thunderstorms and heavy rain have been pummeling the Columbia Basin and northeast WA. The National Weather Service has issued a flood warning for several counties including Okanogan, Bonner, Chelan, Ferry and Pend Oreille, and the Kettle River, which flows through Ferry and Stevens counties, had a record high on May 10 of 22.54 feet on May 10, busting the previous record of 21.1 feet in 1948.
In contrast, over the west, many locations have had little precipitation in May, and there is chance Seattle will have its driest May on record.

Not black and white. But dry and very wet. But why? And is spring flooding in eastern WA unusual?
Let's start by checking out the flooding situation, with information from the NOAA/NWS River Forecast Center in Portland (below). Red dots are floods, blue dots indicated moderate floods, and purple are major floods. And several other locations are at bank-full.

What is going on? The combination of a healthy mountain snowpack and warming temperatures, resulting in rapid melting of snow, and the filling of regional rivers.
Here is the snowpack numbers for April 15th, from the very nice SNOTEL web site. Washington, northern Idaho, and Montana had snow-water amounts well about normal...in some locations above 150% of what is typical.

And snowpack in British Columbia, from which the Columbia River drains was also very high (see table)

So going into spring with a bountiful spring snowpack was step 1.
Then a combination of warming temperatures and increasing spring solar radiation caused rapid snowmelt. The departure of average temperatures from normal (below) shows our temperature anomaly (difference from normal) for the past two weeks, with much of eastern WA and northern Idaho being 6-8F above normal for that period.

So the normal rapid snowmelt of spring was supercharged by warmer than normal temperatures.
But like a late-night commercial, I should note that there's more. The weather pattern has produced wetter than normal conditions east of the Cascade crest (and drier than normal to the west)--see map below of the precipitation departure from normal for 5/3-5/16.

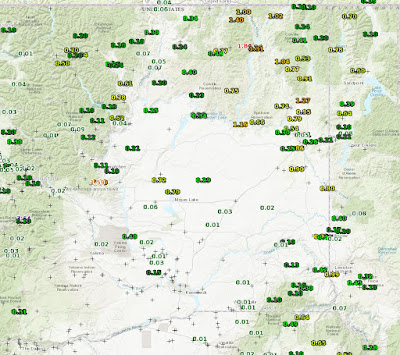
During the past few days, showers and thundershowers have moistened eastern Washington (see radar image for 3 PM yesterday), with the last 24-h totals being impressive. A number of locations in northeast WA have gotten over 1 inch during the last day.

So why wet east of the Cascades and dry west? Because there has been a persistent ridge of high pressure along the coast, with troughs (low pressure) moving into California and northward into eastern WA and Idaho (see upper level--500 hPa--map for 5 PM Thursday to illustrate.) The ridge has kept western WA dry, while the transient troughs have initiated thunderstorms east of the Cascade crest.

It is important to note that spring-time flooding in eastern Washington and along the Columbia is the normal state of affairs in our region. Before the Columbia and Snake River dams were in place, major and often catastrophic flooding was commonplace.
One of the most famous events was the great snowmelt flood of May 1948. Just as in this year, regional mountain snowpack was above normal, unusually warm temperatures hit during mid-month, and thunderstorms dampened eastern Washington. Richland flooded and the surge of water moved down the Columbia, inundating and destroying the city of Vanport (near Portland), which was never rebuilt.

As global warming reduces the regional snowpack later during this century, the threats of such springtime flooding should gradually decline over time.
In contrast, over the west, many locations have had little precipitation in May, and there is chance Seattle will have its driest May on record.
Not black and white. But dry and very wet. But why? And is spring flooding in eastern WA unusual?
Let's start by checking out the flooding situation, with information from the NOAA/NWS River Forecast Center in Portland (below). Red dots are floods, blue dots indicated moderate floods, and purple are major floods. And several other locations are at bank-full.
What is going on? The combination of a healthy mountain snowpack and warming temperatures, resulting in rapid melting of snow, and the filling of regional rivers.
Here is the snowpack numbers for April 15th, from the very nice SNOTEL web site. Washington, northern Idaho, and Montana had snow-water amounts well about normal...in some locations above 150% of what is typical.

And snowpack in British Columbia, from which the Columbia River drains was also very high (see table)

So going into spring with a bountiful spring snowpack was step 1.
Then a combination of warming temperatures and increasing spring solar radiation caused rapid snowmelt. The departure of average temperatures from normal (below) shows our temperature anomaly (difference from normal) for the past two weeks, with much of eastern WA and northern Idaho being 6-8F above normal for that period.

So the normal rapid snowmelt of spring was supercharged by warmer than normal temperatures.
But like a late-night commercial, I should note that there's more. The weather pattern has produced wetter than normal conditions east of the Cascade crest (and drier than normal to the west)--see map below of the precipitation departure from normal for 5/3-5/16.

During the past few days, showers and thundershowers have moistened eastern Washington (see radar image for 3 PM yesterday), with the last 24-h totals being impressive. A number of locations in northeast WA have gotten over 1 inch during the last day.
So why wet east of the Cascades and dry west? Because there has been a persistent ridge of high pressure along the coast, with troughs (low pressure) moving into California and northward into eastern WA and Idaho (see upper level--500 hPa--map for 5 PM Thursday to illustrate.) The ridge has kept western WA dry, while the transient troughs have initiated thunderstorms east of the Cascade crest.

It is important to note that spring-time flooding in eastern Washington and along the Columbia is the normal state of affairs in our region. Before the Columbia and Snake River dams were in place, major and often catastrophic flooding was commonplace.
One of the most famous events was the great snowmelt flood of May 1948. Just as in this year, regional mountain snowpack was above normal, unusually warm temperatures hit during mid-month, and thunderstorms dampened eastern Washington. Richland flooded and the surge of water moved down the Columbia, inundating and destroying the city of Vanport (near Portland), which was never rebuilt.

As global warming reduces the regional snowpack later during this century, the threats of such springtime flooding should gradually decline over time.
from Cliff Mass Weather and Climate Blog https://ift.tt/2Gu2Ypy


